The Rankings
30 cities color-coded by region. Hover any bar for the full 5-metric breakdown. Scroll or pinch to zoom.
Click to explore the full interactive tier list
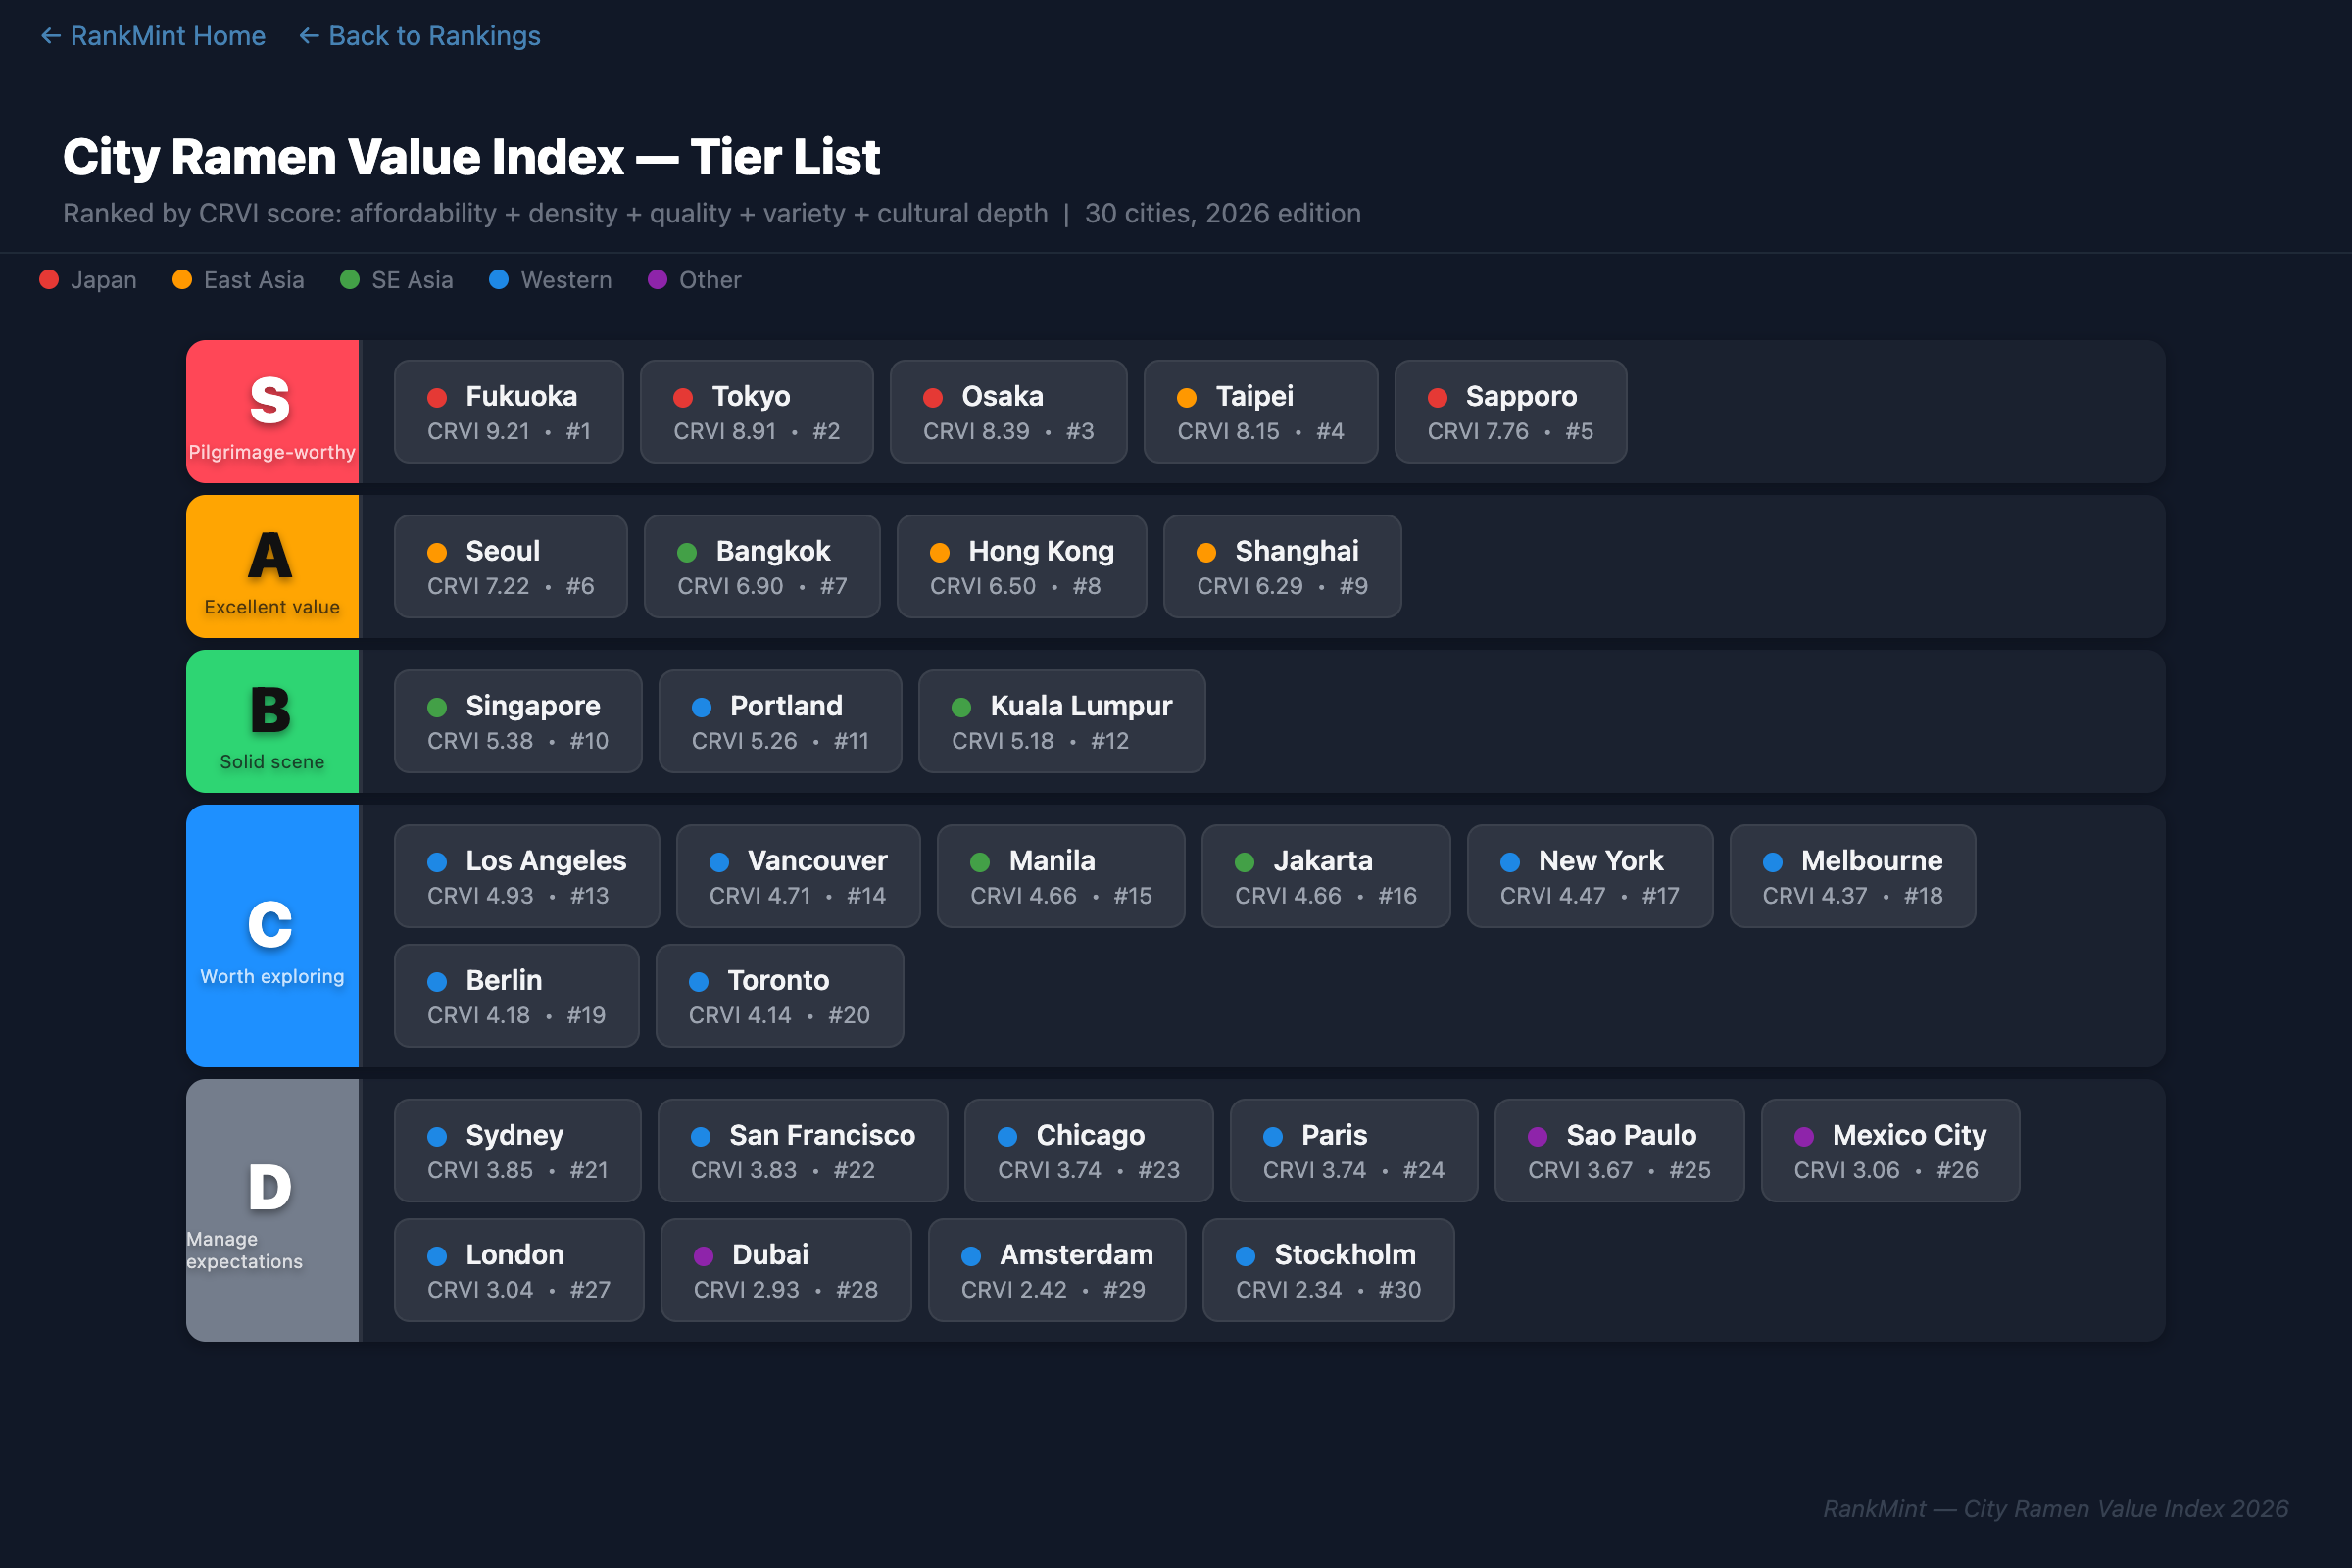
Ranking 30 cities by what ramen is actually worth — affordability, density, quality, variety, and cultural soul. The answer will surprise you.
Tokyo has more shops, more variety, and more Michelin recognition than anywhere on Earth. But when you factor in Fukuoka's perfect cultural depth score (10/10), lower bowl prices, and the undeniable fact that ramen is Fukuoka's civic identity — not just its restaurant category — the birthplace of tonkotsu earns the crown. And Taipei (#4) beats every non-Japanese city on the planet, including Bangkok, Seoul, Hong Kong, New York, and London.
30 cities color-coded by region. Hover any bar for the full 5-metric breakdown. Scroll or pinch to zoom.
Click to explore the full interactive tier list
Ramen here is civic identity, not a restaurant trend. Generational shops, dedicated districts, perfect cultural depth.
| Rank | City | CRVI |
|---|---|---|
| 1 | Fukuoka | 9.21 |
| 2 | Tokyo | 8.91 |
| 3 | Osaka | 8.39 |
| 5 | Sapporo | 7.76 |
Cities punching well above their ramen reputation — Michelin-trained talent, surprising variety, local affordability.
| Rank | City | CRVI |
|---|---|---|
| 4 | Taipei | 8.15 |
| 6 | Seoul | 7.22 |
| 7 | Bangkok | 6.90 |
Cities where ramen has found a real home — genuine scenes, real trade-offs, honest value propositions.
| Rank | City | CRVI |
|---|---|---|
| 8 | Hong Kong | 6.50 |
| 10 | Singapore | 5.38 |
| 11 | Portland | 5.26 |
Premium prices, low density, trend-driven scenes. You'll pay a lot. The bowl may or may not be worth it.
| Rank | City | CRVI |
|---|---|---|
| 17 | New York | 4.47 |
| 27 | London | 3.04 |
| 30 | Stockholm | 2.34 |
Select your city to see how it scored across all five dimensions.
Formula: CRVI = (0.25 x Affordability) + (0.20 x Density) + (0.20 x Quality) + (0.20 x Variety) + (0.15 x Culture). All components normalized 0-10 via min-max scaling before weighting.
Collection date: March 2026 | Cities ranked: 30
| Metric | Weight | Source |
|---|---|---|
| Affordability (Price-to-Wage) | 25% | Numbeo net salary + bowl price research |
| Shop Density (per 100k pop) | 20% | Known anchors cross-referenced with Google Maps / TripAdvisor |
| Quality Ceiling | 20% | Michelin Guide, Tabelog top-100, Time Out editorial picks |
| Style Variety (9 styles) | 20% | City-by-city menu and guide research |
| Cultural Embeddedness | 15% | Qualitative rubric: ramen districts, festivals, local media coverage |